
Sound Control numbers and terms are not rocket science, but sometimes they seem to be exactly that. Besides STC and IIC, there are numerous other acronyms that abound, which can get confusing. Here are some of the basics:
STC & IIC
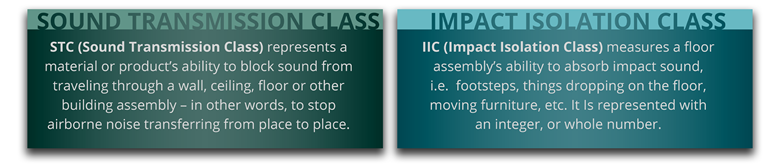
STC and IIC are laboratory test ratings for both airborne and impact sound, respectively. They are expressed as a single number that represents the sound rating for an entire assembly (not a specific product) for either a wall or a floor/ceiling assembly. STC stands for Sound Transmission Class, and IIC stands for Impact Isolation Class. The more sound an assembly can reduce passing through, from the unit above to the unit below, the higher the number. Building code standards dictate for laboratory testing STC and IIC values of 50, while field testing allows for a value of 45.
FSTC & FIIC
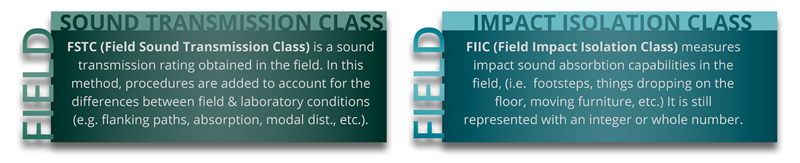
FSTC and FIIC, refer to the same numbers above, however they are associated with actual in situ field test. In addition to these, there are other acronyms that have a variety of different definitions but are highly technical and deal with different field conditions. Some of these are ISR/AIIC/ASTC/NISR just to mention a few. This is where the confusion sets in. In general, these acronyms represent values correlated to either an STC or IIC, based upon field testing measurements, under certain conditions.
What is important to understand is that the basic laboratory testing is done across 16 different sets of data points. Each data point is associated with a different octave band. The data is plotted against a curve for a given IIC or STC number, as can be seen in Graph 1.
GRAPH 1:
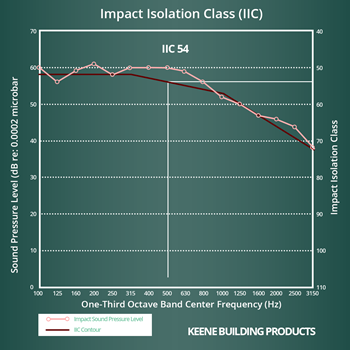
In this example, the data matches an IIC curve (solid line) of 54. Keep in mind, no one data point can deviate from the curve by more than 8 points (these are referred to a deficiencies), and to the sum of all deficiencies cannot exceed a sum total of 32. If either of these criteria are exceeded, then you would have to move the curve up, and subsequently achieve a lower value for the IIC number.
While the single number value makes it easy to compare, it is a bad indicator to compare different assemblies. This can be seen in Graph 2 below.
GRAPH 2:
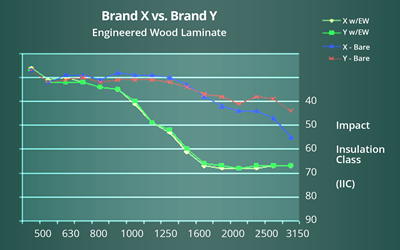
The above shows two different data sets for two different Gypsum underlayments on the same assembly, but focuses in on the mid to high-range frequencies (500 Hz to 3150 Hz). In addition, the darker colored lines have floor covering, while the lighter colored lines are tested over bare gypsum. As you can see there is a great deal of variability between the two set of lines and, therefore, the amount of impact sound they are capable of reducing through the assembly. They vary by as much as 15 to 20 IIC points. Yet, the overall sound ratings for these assemblies differ by only 1 IIC point (A 56 compared to a 57). Keep in mind the human ear can only distinguish a 3 IIC point change. However, on the high frequency side, these two assemblies vary greatly in the amount of high frequency noise transfer you will hear.
CONCLUSION
It is important for architects, building designers and developers to understand what these graphs and numbers mean. It is also important to actually obtain the sound test reports; When comparing different products in an assembly, these graphs will help you determine where the systems are deficient. While the single numbers may not vary greatly, how an assembly of products perform in the low, mid, and high frequency ranges can vary greatly.